
Currently Empty: 0,00 EGP

Understand the complete Data Analysis workflow from raw data to business insightsBuild practical skills through guided learning and hands-on practice.
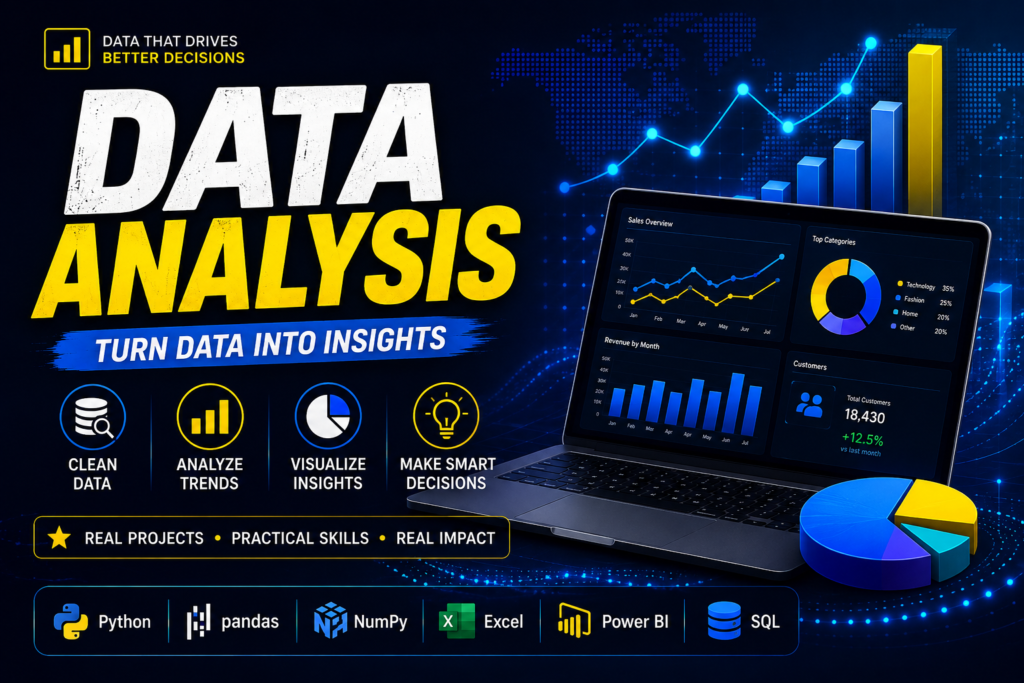
Master Data Analysis from raw data to powerful insights using Python, Excel, SQL, and Power BI through practical exercises, real-world datasets, and professional projects.
Both options start on the announced start date. Days and times differ by mode.
Data Analysis: From Raw Data to Real-World Decisions
Step into the world of professional Data Analysis with a practical, project-driven On-Campus program designed to transform you from someone who works with data into someone who can understand it, automate it, visualize it, and use it to drive real decisions.
This is not a course built around watching tutorials and memorizing commands. You will work hands-on, face-to-face, and step by step with real-world datasets, business scenarios, practical tasks, and complete projects that simulate the work of a professional Data Analyst.
What You’ll Master
Python for Data Analysis
Build a strong Python foundation before moving into professional data analysis with NumPy and Pandas. Learn how to clean, transform, filter, manipulate, explore, and analyze large datasets efficiently.
Python Automation
Go beyond traditional analysis and learn how to use Python to automate repetitive data tasks. Automate data cleaning, file processing, calculations, report preparation, and recurring workflows saving hours of manual work and making your analysis more efficient and scalable.
Excel for Data Analysis
Move from essential Excel skills to advanced analytical techniques, including formulas, data cleaning, PivotTables, lookups, conditional logic, reporting, and professional business analysis.
SQL & Database Analysis
Learn how to communicate with databases and extract exactly the information you need. You’ll work with filtering, joins, aggregations, subqueries, CTEs, window functions, and real analytical business queries.
Power BI & Interactive Dashboards
Transform your analysis into professional dashboards. Learn data modeling, Power Query, DAX, KPIs, interactive reports, dashboard design, and how to turn numbers into a clear visual story.
Data Cleaning & Preparation
Real data is rarely perfect. You’ll learn how to detect and handle missing values, duplicates, incorrect data types, inconsistent categories, formatting problems, invalid records, and outliers.
Exploratory Data Analysis (EDA)
Learn how to investigate datasets, identify patterns, compare variables, discover trends, detect unusual behavior, and uncover insights that aren’t immediately visible.
Data Visualization & Storytelling
A great analyst doesn’t just find insights—they communicate them. Learn how to select the right visualizations and present your findings in a way that stakeholders can quickly understand.
Learn the Complete Analyst Workflow
You won’t learn each tool in isolation.
You’ll learn how they work together in a real Data Analysis workflow:
Raw Data → Data Cleaning → Python Automation → Analysis → SQL → Visualization → Dashboard → Insights → Business Decisions
You’ll learn how to approach a new dataset, understand the business problem, ask the right questions, clean and prepare the data, automate repetitive processes, perform meaningful analysis, build professional dashboards, and finally communicate actionable recommendations.
Built Around Practice, Not Just Theory
Throughout the On-Campus program, you’ll continuously apply what you learn through exercises, assignments, data-cleaning challenges, business cases, and complete projects.
Instead of finishing the course knowing what Python, SQL, Excel, and Power BI are, the goal is for you to know when to use each tool, why you’re using it, and how to combine them to solve real problems.
By the end of the program, you’ll be capable of taking a messy raw dataset from start to finish and transforming it into a professional analytical solution—with cleaned data, automated workflows, meaningful analysis, interactive dashboards, valuable insights, and clear business recommendations.
Your Data Analysis Toolkit
Python • Python Automation • NumPy • Pandas • Excel • SQL • Power BI • Power Query • DAX • Data Cleaning • EDA • Data Visualization • Dashboard Development • Business Insights
Learn on campus. Work with real data. Automate real workflows. Build real projects. Turn data into decisions.
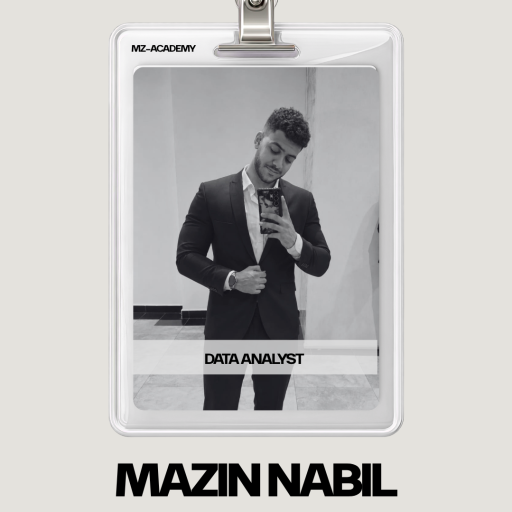
Data Analyst, Data Analysis Instructor, and Founder of MZ Academy, passionate about transforming complex data concepts into practical, real-world skills. He specializes in Python, SQL, Excel, Power BI, data cleaning, visualization, and Python automation, with a strong focus on project-based learning. Through MZ Academy and his teaching experience, he helps students move beyond theory by working with real datasets, solving practical business problems, building professional dashboards, and developing portfolio-ready projects that prepare them for real opportunities in the data industry
in View LinkedIn ProfileBuild practical skills and turn knowledge into real projects.
